An Active Data Representation of Videos for Automatic Scoring of Oral Presentation Delivery Skills and Feedback Generation
 Fasih Haider
 Maria Koutsombogera
 Owen Conlan2
  Saturnino Luz
- 1Edinburgh Medical School, Usher Institute, The University of Edinburgh, Edinburgh, United Kingdom
- 2School of Computer Science and Statistics, Trinity College Dublin, Dublin, Ireland
Public speaking is an important skill, the acquisition of which requires dedicated and time consuming training. In recent years, researchers have started to investigate automatic methods to support public speaking skills training. These methods include assessment of the trainee's oral presentation delivery skills which may be accomplished through automatic understanding and processing of social and behavioral cues displayed by the presenter. In this study, we propose an automatic scoring system for presentation delivery skills using a novel active data representation method to automatically rate segments of a full video presentation. While most approaches have employed a two step strategy consisting of detecting multiple events followed by classification, which involve the annotation of data for building the different event detectors and generating a data representation based on their output for classification, our method does not require event detectors. The proposed data representation is generated unsupervised using low-level audiovisual descriptors and self-organizing mapping and used for video classification. This representation is also used to analyse video segments within a full video presentation in terms of several characteristics of the presenter's performance. The audio representation provides the best prediction results for self-confidence and enthusiasm, posture and body language, structure and connection of ideas, and overall presentation delivery. The video data representation provides the best results for presentation of relevant information with good pronunciation, usage of language according to audience, and maintenance of adequate voice volume for the audience. The fusion of audio and video data provides the best results for eye contact. Applications of the method to provision of feedback to teachers and trainees are discussed.
1. Introduction
Presentation skills are a competency that can be viewed as part of transversal skills, i.e., core skills, such as critical and creative thinking, problem-solving, interpersonal communication and collaboration skills that a person needs to develop to be successful in the twenty-first century society and workplaces (Bellanca and Brandt, 2010). In this framework, presentation skills are considered as part of one's organizational and communication skills. Public speaking is a form of communication that requires a distinctive skills set, including self-awareness, self-control, organization, and critical thinking, which are reflected in multimodal, verbal and non-verbal elements of information delivery. A challenge in education and training has been to develop the ability to deliver skill assessments in a personalized, reliable, cost-effective, and scalable manner. Within this context, automatic assessment of presentation skills can be viewed as an emerging assessment model to measure presentation skills that addresses the burdens of time and cost, given that, until recently, this kind of assessment has relied on human ratings (Schreiber et al., 2012; Ward, 2013). This study moves toward a rich assessment system by taking into account multimodal behavior.
Several studies have elicited audio and visual cues that are linked to presentation quality. The role of prosody in delivering successful presentations has been highlighted in several manuals of public speaking, where it is advised that a presenter should have a lively voice, with variations in intonation, rhythm and loudness (Lamerton, 2001; Grandstaff, 2004). The liveliness of speech has also been associated with the perception of enthusiasm. Hincks (2005) hypothesized that subjects with high pitch variation are perceived as lively speakers. This hypothesis was tested using a data set of 18 native Swedish speaking students of technical English which was annotated by eight teachers for the feature of liveliness. This study showed that the correlation between pitch variations and liveliness is statistically significant for both male and female speakers. An experiment by Traunmüller and Eriksson (1995) showed that the liveliness of speech is related to fundamental frequency (F0) excursions. However, the deviation in fundamental frequency is not the only measure that discriminates lively speech from monotonous speech (typical of depressive states) (Kuny and Stassen, 1993); speech rate also represents liveliness of speech and has stronger correlation with it than pitch variation (Traunmüller and Eriksson, 1995). Fast rate of speech, lower voice level and high speech intensity are listed among the characteristics of self-confident voices in several studies (Lamerton, 2001; Grandstaff, 2004).
Other characteristics that are believed to contribute to the success of a presentation include the speakers' ability to establish contact with their listeners (e.g., eye contact) and be aware of their body language. Specific postures that supposedly denote self-confidence, such as standing straight with feet aligned under the shoulders, and both feet flat on the ground, are recommended by public speaking guides, while postures that denote lack of self-confidence, such as fidgeting, crossing the legs, gesturing widely without evident purpose, are discouraged (DeCoske and White, 2010).
Recently, the focus of related research has been on developing systems that could be used as instructors for training humans for public speaking situations, such as systems for training communication skills of students (Liu et al., 2016; Carnell et al., 2019). Moreover, an important aspect of these systems would be the ability to generate real-time feedback, a core aspect of a learning process (Hattie and Timperley, 2007) that enables trainees to understand and control their skills.
The input data to such systems is provided in video format (a combination of audio and video streams). Video processing is an active area of research, as demonstrated by the interest generated by recent video classification competitions, such as the YouTube-8M challenge (Lee et al., 2018) organized by Google AI (Garg, 2018; Lin et al., 2018; Tang et al., 2019). Within a video one may also be able to distinguish different “atomic events”, such as social signals, which could be employed in the assessment of presentation skills. It is in this sense that we use the term “events” in this paper. These types of events might be denoted by specific combinations of body movements and intonation patterns by a speaker within an identifiable time interval. Detection of events related to human behavior, such as human-action (Uijlings et al., 2015), human-activity (Das et al., 2019; Singh and Vishwakarma, 2019), emotion (Haider et al., 2016b; Cowen et al., 2019; Haider and Luz, 2019; Hassan et al., 2019) and engagement (Curtis et al., 2015; Huang et al., 2016) have received increasing attention in the video analysis literature. A video of a talk or presentation will typically contain a combination of different social signals. The detection of such signals could be employed as a processing step toward generation of feedback for public speaking training. Similarly, an event-based presentation assessment method would need to detect many events within a video before automatic inference about the presentation as a whole can be performed.
However, the development of event detectors is a time consuming task, requiring segmentation and annotation of videos for multiple events (i.e., social signals) for supervised learning. Consider, for instance, a 10-min long video labeled as an example of a good oral presentation in terms of self-confidence, that is, a presentation in which speakers are able to reflect their self-confidence through voice and body gestures. A video classifier feature vector could be created from the outputs of gesture recognition (Ju et al., 2019; Yung et al., 2019) and affect recognition. Such an approach would require the development of separate gesture and affect recognition modules in the context of public speaking, implying human and computational costs associated with identifying the laws and principles of use of the social signals, annotation of social signals and processing of large amounts of video data. For example, Ochoa et al. (2018) use the OpenPose C++ Library (Cao et al., 2017) for event detection, such as gestures and gaze in the context of public speaking situations.
An alternative approach would be to build a video classifier directly based on a large video data set, such as the MLA datset (Ochoa et al., 2014) which is annotated at the video level rather than at event level, without the use of event (such as social signal) detectors. The method proposed in this paper takes this alternative approach, employing low-level features for unsupervised clustering as a pre-processing step to presentation quality classification, rather than supervised event segmentation and categorization. In this new approach, if the focus is, for instance, to provide feedback about gestures, the system would identify those clusters which include gestures related to positive/negative performance through statistical testing between clusters and video-labels.
Previous studies conducted on the MLA dataset (Chen et al., 2014; Luzardo et al., 2014; Ochoa et al., 2014) used a statistical representation of audiovisual features (e.g., mean and standard deviation values of fundamental frequency for full presentation) to create a data representation of a full presentation video for a prediction task. Our contention is that the human social behavior varies over time in a presentation and modeling that behavior by averaging low-level features for a full presentation using statistical functions (e.g., mean and standard deviation values of pitch for a full presentation) will result in poor modeling of social signals. Moreover, none of those studies evaluated conventional camera videos to predict presentation delivery skills within presentations/videos. Hence all the studies conducted on the MLA dataset depend on the Kinect sensor (as an event detector) to perform visual analysis.
In the present study, we model spoken expressions, body gesture and movements of the presenters using active data representations (thus removing the dependency on the Kinect sensor and event classifiers for audio-visual analysis). First, we extract audio-visual segments of student presentations (details for audio and video segmentation are given in sections 2.2, 2.3, respectively) and then we perform clustering of the resulting dataset of segments. After clustering the dataset, an active data representation (ADR) is generated and used to predict the expert evaluations of presentation delivery skills of presenters. Finally, statistical analysis is performed in order to identify the relationship between the clusters (where clusters represent spoken expression and body posture and gestures) and expert evaluations of presentation delivery skills of presenters. The proposed system architecture is depicted in Figure 1, where the user (i.e., a presenter, potential viewer, teacher or a video summarization tool) obtains feedback about a presentation. The feedback is in the form of audio-video segments that require further attention, for improvement (“bad segments”) or as examples of good performance (“good segments”) within a video/presentation, along with the predicted score of experts' evaluation. The goal of this paper is to introduce a method to automatically model spoken expressions, body gestures and movements of presenters within videos which are annotated at video level, rather than at event level, for automatic scoring of oral presentation delivery skills and feedback generation.
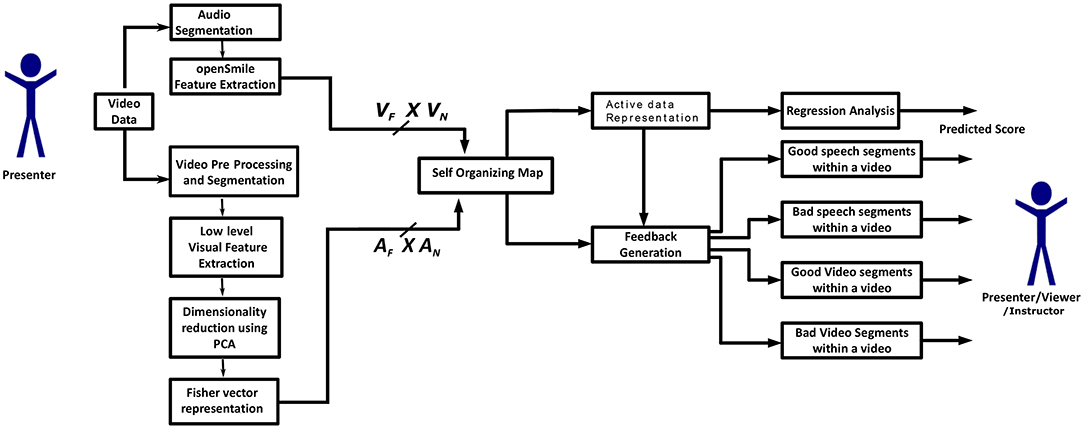
Figure 1. System architecture: AN is the total number of audio segments (AN = 7, 573), AF is the total number of audio features (AF = 587), VN is the total number of video segments (VN = 58, 541) and VF is the total number of visual features (VF = 4, 608) in the MLA dataset.
2. Materials and Methods
We have devised a novel Active Data Representation (ADR) method to represent the audio and visual data used in this study. The details for each of these media are given in sections 2.2, 2.3, respectively. Briefly, our proposed procedure for generating the ADR encompasses the following steps:
1. Segmentation and feature extraction: each video Vi (i ∈ {1, …, N}, where N is the total number of videos) is divided into n segments Sk,Vi, where k varies from 1 to n. Hence Sk,Vi is the kth segment of the ith video, and audiovisual features are extracted over such segments, rather than over the full video. The system architecture is depicted in Figure 2.
2. Clustering of segments: We used self-organizing maps (SOM) (Kohonen, 1998) for clustering segments Sk,Vi into m clusters (C1, C2, …., Cm) using audio-visual features. Here m represents the numbers of SOM clusters.
3. Generation of the Active Data Representation (ADRVi) vector by calculating the number of segments in each cluster for each video (Vi).
4. Normalization: as the number of segments is different for each video (i.e., the duration of all videos is not constant), we normalize the feature vector by dividing it by the total number of segments present in each video (i.e., the L1 norm of ADRVi), as shown:
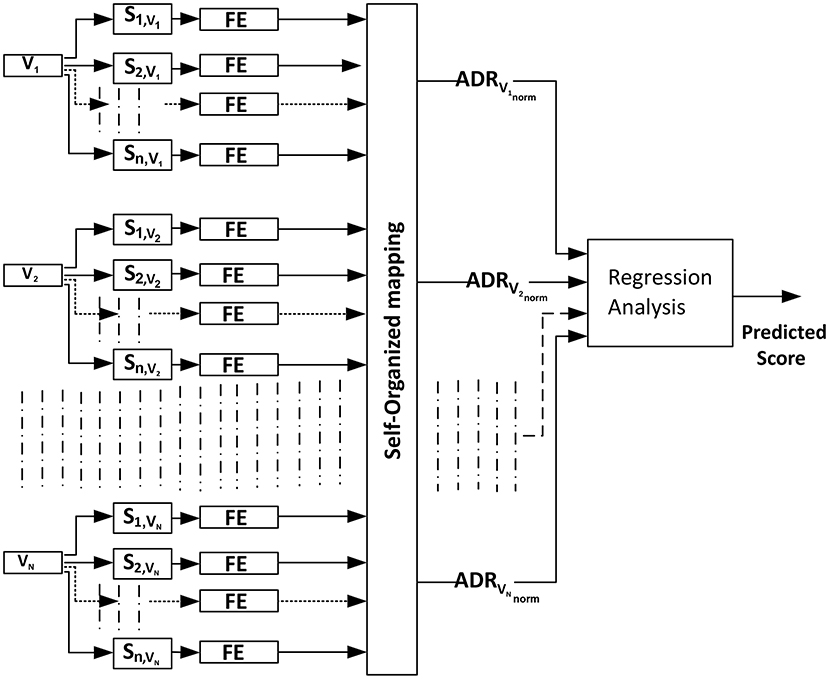
Figure 2. Automatic scoring of an oral presentation process using the Active Data Representation (ADRVinorm) method where FE represents the extraction of low level features from segments of videos.
2.1. The Dataset
The data used for the experiments are presentations contained in a sub-corpus of the Multimodal Learning Analytics (MLA) data set (Ochoa et al., 2014). In total there are 441 oral presentations (videos) in the data set. The presentations are given by Spanish-speaking students who present projects about entrepreneurship ideas, literature reviews, research designs, software design, among other topics. Approximately 19 h of multimodal data are available. In addition, the annotation encompassed individual ratings for each presentation, and group ratings related to the quality of the slides used when doing each presentation. Each video/presentation has a score ranging from 1.00 to 4.00 (where a high score indicates better presentation skills than a lower score) awarded by a teacher based on the following performance factors:
1. Structure and connection of ideas (SCI),
2. Presentation of relevant information with good pronunciation (RIGP),
3. Maintenance of adequate voice volume for the audience (AVV),
4. Usage of language according to audience (LAA),
5. Grammar of presentation slides (GPS),
6. Readability of presentation slides (RPS),
7. Impact of the visual design of the presentation slides (VDPS),
8. Posture and body language (PBL),
9. Eye contact (EC), and
10. Self-confidence and enthusiasm (SCE).
There are two main presentation performance components. One is presentation delivery skills, S = {SCI, RIGP, AVV, LAA, PBL, EC, SCE}, and the other is the appearance of slides (i.e., GPS, RPS, VDPS). To define an overall Presentation Delivery (PD) score for a student, we averaged the scores of all presentation delivery skills. The students' scores in the MLA data for each presentation delivery skill are shown in Table 1 along with presentation delivery (PD) score. In Table 1, it is observed that the students score less for SCE and PBL than for other skills and that the PD has the least variance. Previous work (Haider et al., 2016a) demonstrates that all presentation delivery skills are correlated with each other and the scores assigned to multidimensional ratings (EC, SCE, etc.) are more likely to be unreliable than a single averaged score, such as the PD score for each presentation (Chen et al., 2014). For this reason we estimated the overall PDi factor for a video Vi as the arithmetic mean of the presentation delivery skills scores for that video, that is .
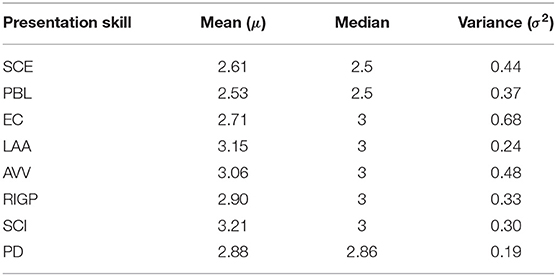
Table 1. Score assigned by tutors to students' presentation skills.
2.2. Active Audio Data Representation
Speech activity detection is the first task to be implemented and is performed on the audio information of the MLA data set using the LIUM toolkit (Rouvier et al., 2013). The duration of audio segments (i.e., output of speech activity detection) varies between 1 and 20 s. The speech activity detection task resulted in 7,573 audio segments.
Acoustic feature extraction was then performed using the openSMILE toolkit (Eyben et al., 2010). The Emobase1 feature set was extracted. This set is also used for on-line emotion and speech expression recognition (Eyben et al., 2009) and consists of 988 low-level descriptors as well as statistical functionals applied to these descriptors. In addition, we performed a correlation test between the duration of each audio segment and its features, selecting those features which are less correlated with audio segment duration (R < 0.2) to avoid any bias of the clustering algorithm toward the duration of segments. This process resulted in 587 features in total for each audio segment. The feature set was further centered with mean value 0 and standard deviation 1.
We used the SOM algorithm (Kohonen, 1998) for clustering the audio segments using the 587 acoustic features extracted as described above. There is no prior knowledge available on the number of clusters in students' presentations. However, a study conducted on audio books data suggests that there are 50 different clusters (types of spoken expressions, such as spoken emotion or voice style) in those data (Vanmassenhove et al., 2016). Therefore, we used different number of clusters (m = 5, 10, 15, …, 100) for generating the audio data representation. An example of SOM Clustering output is depicted in Figure 3. The audio data representation is generated by calculating the number of audio segments in each segment and normalizing the resulting vector, as shown in Equation (1). We perform clustering using low-level audio features which have been widely used for emotion and spoken expression recognition (i.e., emotion expressed in speech). As segments in one cluster have a higher probability of sounding similar to one another than segments between clusters, the audio data representation can be regarded as modeling of the presenters' “spoken expressions.”
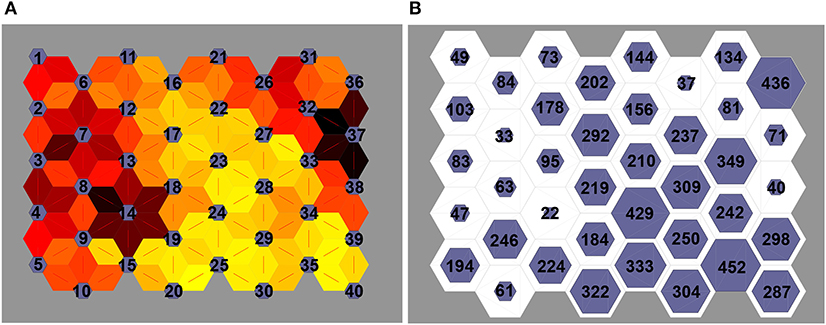
Figure 3. (A) Indicates the distance between clusters (darker color indicates more distance between clusters than lighter colors) and (B) indicates the number of audio segments present in each cluster.
2.3. Active Video Data Representation
As a first step, the videos are converted to gray scale images and then adaptive Gaussian thresholding is employed to control lighting conditions. Next, median blurring filtering is used for image enhancement. An example of a pre-processed image from a video/presentation using openCV (Itseez, 2018) is shown in Figure 4.
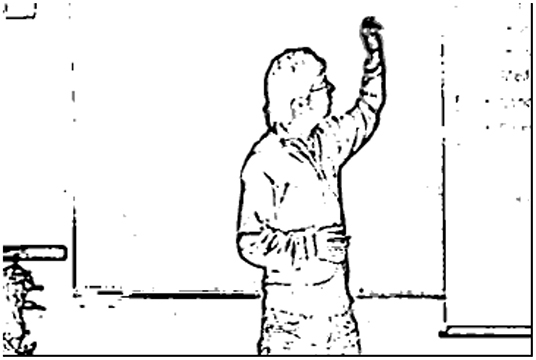
Figure 4. An image from a pre-processed video.
Each video is then divided into small segments with duration of 1 s using FFMPEG (FFmpeg Developers, 2016) with no-overlap between neighboring video segments (the last video segment is not included in the analysis if its duration is <1 s). This process results in 58,541 video segments for low-level visual descriptor extraction.
Regarding visual features, from each video segment we extract dense histograms of gradients (DHOG) (Dalal and Triggs, 2005), dense histograms of flows (DHOF) using the method devised by Horn and Schunck (1981), and dense motion boundary histograms (DMBH), which have been previously used to capture the movements of subjects for human action and attitude recognition in videos (Uijlings et al., 2015; Haider et al., 2016b). The purpose of using these features is to capture the body movements and postures of students.
The block size chosen for each visual descriptor is 12 by 12 pixels by six frames. For aggregating the descriptor response, a single frame (out of six frames) for HOG (frame 3), and three frames (frame 2, 4, and 6) for HOF and MBH are used. As a result, 144 descriptors are extracted for each aggregated frame, and they are further reduced to 72 descriptors using principal component analysis (PCA) over each video segment. Next, a Fisher vector representation of the visual descriptor (Vedaldi and Fulkerson, 2008; Perronnin et al., 2010) is generated using a common cluster set size of 64 for a Gaussian Mixture Models (GMM) (Chatfield et al., 2011). As a result, 4,608 visual features are extracted for each video segment. These parameters (aggregation, block size, etc.) follow the best parameters for a human action recognition problem on a recent a video classification study (Uijlings et al., 2015).
SOM are again used for clustering video segments using Fisher vector representations of DHOG, DHOF, DMBHx, DMBHy, and their fusion. The SOM is trained using the batch algorithm with 200 iterations. As before, we iterated over different numbers of clusters in generating the active visual data representation to identify the optimal number for automatic scoring of oral presentation delivery skills. The video data representation is generated by calculating the number of video segments in each cluster for each video. Normalization is applied as above to account for different segment sizes. There are in total five visual data representations using Fisher vectors of DHOG, DHOF, DMBHx, DMBHy, and their fusion.
We perform clustering using low-level visual features which have been widely used for human action recognition, so we can claim that the clusters representing body posture and movements (gestures) are grouped according to similarity.
2.4. Experiments
Two experiments have been performed which cover two aspects of automated presentation performance feedback, namely: (a) automatic rating of presentation skills, where we employ regression methods to predict the score (awarded by tutors) to each presentation skill described in section 2.1, Table 1, and (b) analysis of the usefulness of the audiovisual ADR representation in discriminating between good and poor presentation performance according the aforementioned skills. These experiments are described in more detail below.
2.4.1. Experiment One: Automatic Scoring of Presentation Skills
In this experiment, we employed a Gaussian Process (GP) regression model with a squared exponential kernel function (Rasmussen and Williams, 2006) in a 10-fold cross-validation setting. This was implemented using MATLAB (2019). The GP model predicts the regression score using the audiovisual data representations, and the best regression score identifies the optimal number of clusters for the MLA dataset. Support Vector Machines (SVM) using linear kernel was also used for comparison, also through 10-fold cross-validation. These methods were chosen because they are two top performing machine learning methods for regression. They are both non-parametric methods, and project inputs into feature space. SVM is not sensitive to outliers (which is desirable when annotation may not be reliable), and GP regression generalizes well on smaller datasets (441 videos/instances). These characteristics make these methods suitable to our model and data.
The regression models were evaluated using two measures, namely: the mean-squared error (MSE) and the absolute value of correlation (|r|) between predicted score and annotated score.
2.4.2. Experiment Two
Here we investigate whether spoken expressions (as characterized in section 2.2) and video clusters can distinguish good presentations from poor ones. Accordingly, we attempted to refute the (null) hypothesis that the number of audio/video segments in each cluster has the same mean value for poor and good presentation delivery skills (e.g., EC, SCE, and SCI). To annotate the presentations in terms of quality of the student's specific presentation delivery skills we dichotomise according to the human assigned scores. A presentation was labeled as “good” with respect to a presentation skill if it had a score greater than the median value of that skill (Table 1), and was labeled “poor” otherwise. We performed this statistical test for each presentation delivery skill using the assigned labels and the number of audio/video segments within each cluster. The optimal number of clusters is obtained using the regression analysis resulting from experiment one (section 2.4.1).
3. Results
3.1. Score Prediction With Active Audio Data Representation
The best results (highest correlation, p-value for highest correlation, MSE and optimal number with respect to correlation coefficient value) of GP and SVM regression models for audio data representation are shown in Tables 2, 3, respectively, for each oral presentation delivery skill2. The results of regression analysis for all cluster set sizes are shown in the Supplementary Material. The results show that the audio data representation is able to predict the annotated score, and the correlation between annotated score and predicted score is statistically significant. As multiple (20) comparisons were made to select the best cluster sizes (m parameter), we adjusted the original critical significance level of p < 0.05 down to p < 0.003 by applying Bonferroni correction. Therefore, the results confirm that the audio data representation (i.e., spoken expressions) can help in detecting someone's presentation delivery skills and the top three best results are for EC (r = 0.46), PD (r = 0.40), and SCE (r = 0.36). The GP provides better results than SVM for SCE, PBL, EC, SCI, and PD. In some cases, such as EC, both the correlation coefficient and MSE are high. This is due to the fact that the EC score has a higher variance than other factors as depicted in Table 1. This may indicate that the specific scores given by the raters varied widely but nevertheless preserved a consistent rank order among presentations. This is further discussed in section 3.4.
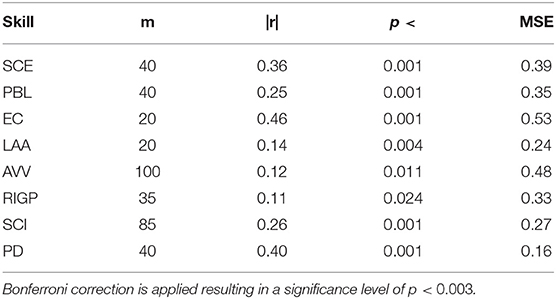
Table 2. Best GP regression model results and number of clusters for each presentation delivery skill, using the audio (spoken expressions) data representation.
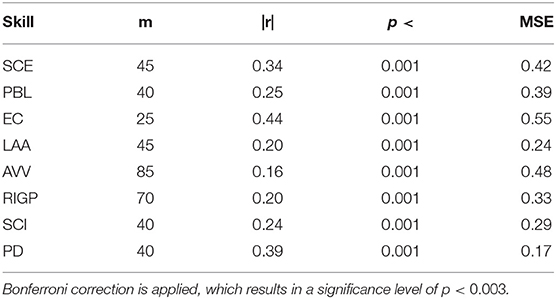
Table 3. Best SVM regression model results for each presentation delivery skill and number of clusters, using the audio (spoken expressions) data representation.
3.2. Score Prediction With Active Visual Data Representation
In this section, we present the results for the evaluation of five different visual data representations (DHOG, DHOF, DMBHx, DMBHy, and their fusion, VF) using the GP and SVM regression methods. This evaluation will help identify the best visual data representation and the optimal number of SOM clusters to predict the score of presentation skills. We have fused the Fisher vector of DHOG, DHOF, DMBHx, and DMBHy using PCA and then used the fusion of features as input to self-organizing mapping as depicted in Figure 5.
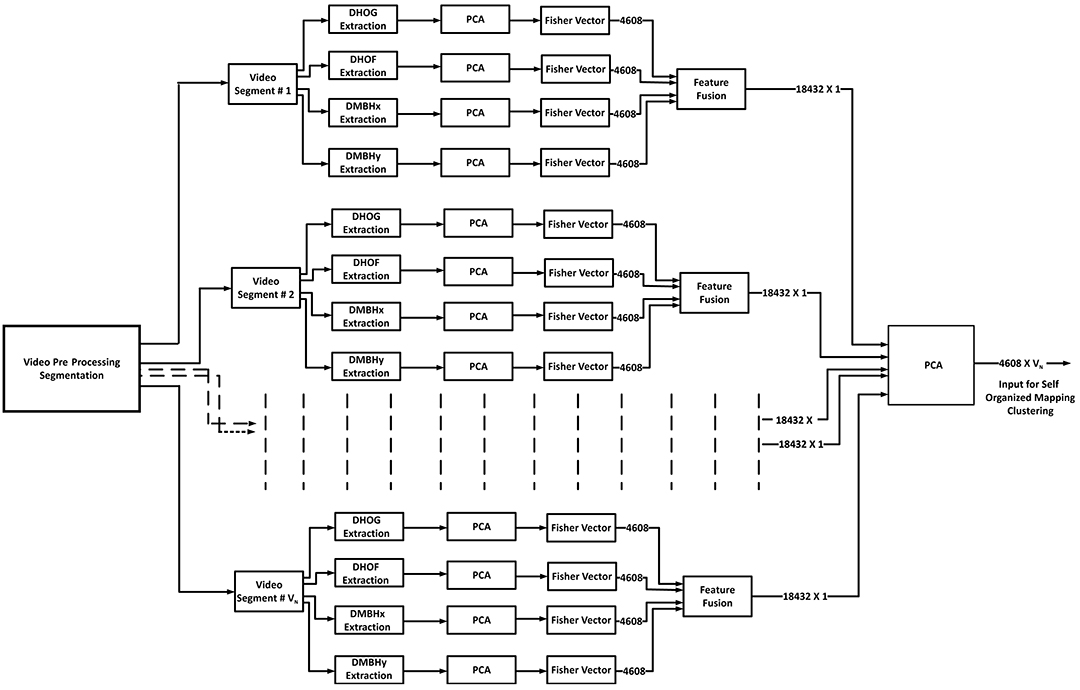
Figure 5. Visual feature fusion: where VN is the total number of video segments (VN = 58, 541) in the MLA dataset.
The best results for the various data representation are shown in Tables 4, 53.
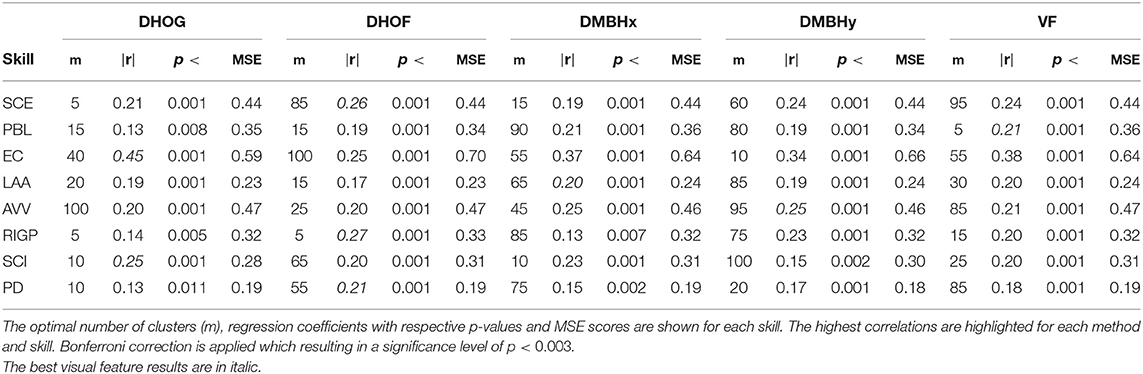
Table 4. Best GP regression model results for each presentation delivery skill for each visual data representation method.
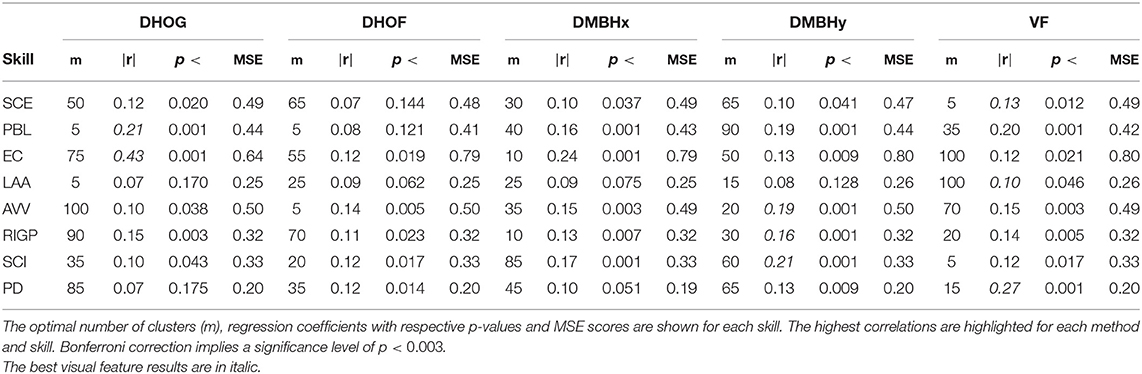
Table 5. Best SVM regression model results for each presentation delivery skill for each visual data representation method.
From the results of visual data representations reported in this section, we have identified the best visual features and the Best Number of Clusters (m) for each visual data representation under GP and SVM regression models.
For the GP regression model:
• the DHOG data representation provides the best result for EC (m = 40, r = 0.45, MSE = 0.59) and SCI (m = 10, r = 0.25, MSE = 0.28);
• DHOF provides the best results for SCE (m = 85, r = 0.26, MSE = 0.44), RIGP (m = 5, r = 0.27, MSE = 0.33), and PD (m = 55, r = 0.21, MSE = 0.19);
• DMBHx and DMBHy data representations provide the best results for LAA (m = 65, r = 0.20, MSE = 0.24) and AVV (m = 95, r = 0.25, MSE = 0.46), respectively;
• the visual fusion (VF) data representation provides the best result for PBL (m = 5, r = 0.21, MSE = 0.36).
For the SVM regression method:
• the DHOG data representation provides the best result for PBL (m = 5, r = 0.21, MSE = 0.44) and EC (m = 75, r = 0.43, MSE = 0.64).
• DMBHy provides the best results for AVV (m = 20, r = 0.19, MSE = 0.50), RIGP (m = 30, r = 0.16, MSE = 0.32), and SCI (m = 60, r = 0.21, MSE = 0.33).
• the VF data representation provides the best results for SCE (m = 5, r = 0.13, MSE = 0.49), LAA (m = 100, r = 0.10, MSE = 0.26), and PD (m = 15, r = 0.27, MSE = 0.20).
SVM provides better results for only PD using VF, with a cluster size of 15. For the remaining presentation delivery skills, GP provides better results than SVM.
3.3. Active Audiovisual Data Representation
For generating the audiovisual (AV) data representation, we fused the active data representations (audio and visual) generated using the best numbers of clusters. Those best video data representations which were fused with the best audio data representations are highlighted in Tables 4, 5 for GP and SVM, respectively. The results (highest correlation, p-value for highest correlation, minimum MSE and cluster size for highest correlation) for the AV data representation are shown in Tables 6, 7 for each oral presentation delivery skill. The results show that the AV data representation (spoken expressions, body gestures, and movements) is able to predict the annotated score, and the correlation between annotated score and predicted score is statistically significant (p < 0.05) in most of the cases. The top three results using this data representation are for EC (r = 0.49), PD (r = 0.40), and SCE (r = 0.33). GP provides better results than SVM for EC, RIGP and SCI. While the fusion of audio and visual data representations improves the results for EC only, the results for the overall rating (PD) are close to the best performing (audio only) feature representation.
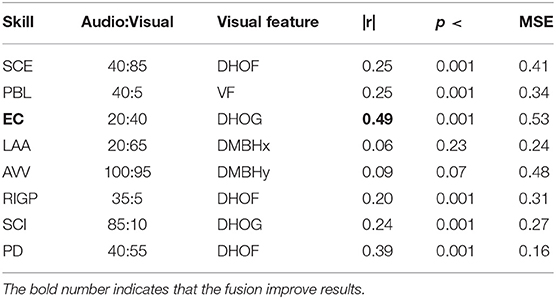
Table 6. Best GP regression model results for each presentation delivery skill (such as SCE, PBL, etc.) using Fusion of Audio-Visual features.
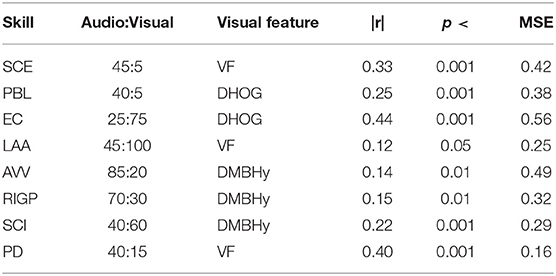
Table 7. Best SVM regression model results for each presentation delivery skill (such as SCE, PBL, etc.) using Fusion of Audio-Visual features.
3.4. Regression Analysis
From the results of all data representations, we observed that the audio data representation provides the best results for SCE (r = 0.36, MSE = 0.40), PBL (r = 0.25, MSE = 0.35), SCI (r = 0.26, MSE = 0.27), and PD (r = 0.40, MSE = 0.16) using the GP regression method. The DHOF data representation provides the best results for RIGP (r = 0.27, MSE = 0.33). The DMBHx data representation provides the best results for LAA (r = 0.20, MSE = 0.24). The DMBHy data representation provides the best results for AVV (r = 0.25, MSE = 0.46) using GP regression. The fusion of audio and DHOG data representation provides the best result for EC (r = 0.49, MSE = 0.53) with the same regression method. From the MSE scores, it is also observed that although the correlation among predicted and annotated score is significant in some cases, there is high mean-squared error particularly for EC where the correlation coefficient is 0.4924 and MSE is 0.5254. This may be due to lack of reliability in the scores given by tutors in the case of multidimensional scoring as suggested by Chen et al. (2014). However, for the PD factor, the correlation is 0.4008 and MSE is the lowest (MSE = 0.17). Accordingly, the lower MSE for PD compared to other presentation delivery skills reflects the fact that the average score (PD) is more reliable than the individual scores as the variance of PD is the least as depicted in Table 1.
3.5. Discriminating Good and Poor Presentations
From the regression analysis results, it is observed that the cluster size of 40 provides us with the best result for the PD factor. Hence, we can assume that there are about 40 different spoken expressions in the MLA data set which contribute toward prediction of this factor. We used the spoken expression data representation with the cluster size of 40 as a feature vector for statistical testing. The SOM output is depicted in Figure 3. The Kruskal–Wallis test rejects the null hypothesis (p < 0.05) formulated in section 2.4.2 for many clusters (spoken expressions). Speech segments in cluster number 9, 14, 34, 2, 3, 12, 17, 20, 4, 18, 19, 23, and 28 have significant differences in their mean values for good and poor presentations. Speech segments from cluster number 9, 14, and 34 have higher means for good presentations than poor presentations, hence we can say that the audio segments in these clusters (that represents spoken expression) represents good presentation delivery skills. The clusters number 2, 3, 12, 17, 20, 4, 18, 19, 23, and 28 have higher mean for poor presentations than for good presentations, hence we can say that the audio segments in these clusters represent poor presentation delivery skills.
We can use this method for generation of feedback for each presentation delivery skill by choosing the best cluster sizes for audio and the best cluster sizes and best video representation for video as shown in Tables 8, 9. The feedback generation using statistical evaluation may also support presentation summarization and search applications, for instance, by combining all the good parts of a presentation (summarization), and enabling search for the good or poor parts of a presentation.
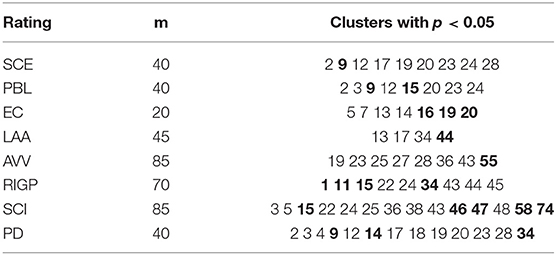
Table 8. Statistically significant clusters of audio segments for each rating/skill, where the bold cluster number has the higher value for good presenters, and the remaining cluster numbers have higher value for bad presenters.
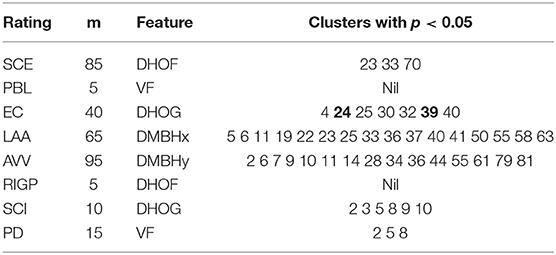
Table 9. Statistically significant clusters of video segments for each rating/skill, where the bold cluster number has the higher value for good presenters, and the remaining cluster numbers have higher value for bad presenters.
4. Discussion
4.1. Related Work
Automatic rating of presentation delivery skills is an open research challenge which has been addressed by a number of research groups. Krajewski et al. (2010) compared multiple classifiers using a set of prosodic and spectral features on a limited dataset, in their study on self-confidence detection. Their data set contained 306 audio segments (each of 1 min duration) of 14 female speakers delivering regular lectures, ranked by five experts for self-confidence. The classifiers were able to detect two classes (low self-confidence and high self-confidence) with a maximum accuracy of 87.7 and 75.2% for speaker-dependent and speaker-independent settings, respectively. In contrast, in our study, expert evaluation (annotated score between 1.00 and 4.00) is available for the full presentation video (video-level based annotation) rather than for each segment. The approach presented in this paper addresses the problem in a more general manner than the segment-level based annotation.
Other studies have been conducted on the MLA data set (Ochoa et al., 2014), which contains the presentations of students and their scores by teachers as described in section 2.1. Luzardo et al. performed two-class (good or poor) classification experiments to predict quality of slides (SQ), SCE, RIGP, and AVV. For predicting SCE, AVV, and RIGP, Luzardo et al. used the audio features (minimum, maximum, average and standard deviation of pitch calculated for each student presentation/video) for the two-class (good or poor) classification task, which resulted in an accuracy of 63% (SCE), 69% (AVV), and 67% (RIGP) (Luzardo et al., 2014). Chen et al. proposed a different approach. First, they performed principal component analysis on the teacher's ratings for all the presentation skills (SCE, AVV, RIGP, etc.) and then derived two principal components (corresponding to delivery skills and SQ) which they used as the target functions for a regression task. They used audio (speech rate and statistical functionals of intensity and pitch contours) and visual (body movements provided by the Kinect sensor) features for predicting the score for presentation delivery skills. For SQ, they used readability, grammar and visual design features (Chen et al., 2014). Echeverria et al. employed machine learning methods to classify presentations according to performance (good vs. poor) using visual (Kinect sensor) features, achieving accuracy scores of 68 and 63% for eye contact and “body language and posture,” respectively (Echeverría et al., 2014).
The aforementioned studies (Chen et al., 2014; Luzardo et al., 2014; Ochoa et al., 2014; Haider et al., 2016a) analyzed statistics (mean, median values, etc.) of acoustic features over a presentation and showed that acoustic features can predict some of the presentation delivery skills. In this study, however, we demonstrate that the ADR can predict all presentation delivery skills. The proposed system can also generate automatic feedback for the presenter or viewer in the form of video segments, as described in section 3.5, while previous studies (Chen et al., 2014; Luzardo et al., 2014; Ochoa et al., 2014; Haider et al., 2016a) were not able to generate feedback using the audio/video data but relied on the Kinect sensor data. While extrinsic evaluation of different feedback user interfaces is necessary, and particularly important in assessing the usefulness of the selected audio/video segments for the trainee, our approach presents a novel and promising tool for building such user interfaces.
The methods developed for video classification using neural network, such as Non-local NetVLAD Encoding (Tang et al., 2019), Long Short-Term Memory (LSTM) (Garg, 2018), and NeXtVLAD (Lin et al., 2018) are able to predict video labels with high accuracy, in the context of entity recognition. However, these approaches are not a good fit for a tutoring system for public speaking due to poor interpretability. As noted before, in addition to labeling a presentation with respect to its quality, it is necessary to segment the presentation video and provide feedback on the relevant segments. This makes a direct comparison between ADR and current methods for video classification, such as (Garg, 2018; Lin et al., 2018; Tang et al., 2019) difficult, even though in principle the latter could be applied to presentation quality assessment.
The work most closely comparable to ours is the study by Chen et al. (2014). However, a few differences between that study and ours should be noted. In particular, Chen et al. (2014) considered only 14 out of 27 sessions of the MLA dataset while we analyzed the full dataset, they only predicted the score of overall presentation delivery skills (i.e., a score similar to our PD factor) while we additionally predicted each presentation skill, and they employed the kinect sensor for visual analysis while we use standard video. Despite tackling more challenging predicitve tasks, our study achieved similar results to those in Chen et al. (2014). While their regression models for overall presentation quality achieved higher coefficients than ours (r = 0.511 for speech features, r = 0.382 for kinect features, and r = 0.546 for multimodal features), their method is not able to provide the same detailed feedback to users that our method can provide, that is, feedback about which parts of the presentation and which particular skills need improvement.
4.2. Contributions of This Study
The experimental results discussed in this paper extend the results of the experiments reported by Haider et al. (2016a, 2017). Haider et al. (2016a) extracted visual features from the presentations using a Kinect One sensor4. Haider et al. (2017) generated a form of ADR using audio features for fairly large scale videos (i.e., 10–15 min in duration) which demonstrate the potential of the ADR method for predicting the online-user engagement in TED talks (i.e., predicting a label provided by an online viewer for a video of 10–15 min duration) which is associated with a full TED talk without doing any annotation of events. However, ADR has not been previously used for visual features nor for predicting expert evaluation of student presentations.
The optimization parameter of ADR is number of clusters (m) and we employed grid search over 20 values (m = 5, 10, 15, .…100) to optimize the representation for the regression task. The full results are reported in Supplementary Material. Bonferroni correction (p < 0.05/20 = 0.003) has been applied, and the results show that the predicted labels are correlated by the target labels (expert evaluation) and that correlation is statistically significant.
In line with other works (Chen et al., 2014; Luzardo et al., 2014; Ochoa et al., 2014), our previous study exploited only full presentations; it could not identify which audio/video segments within the presentation best represented presentation delivery skills because a statistical response (mean, standard deviation, minimum, maximum values, etc.) of features was calculated as a feature vector for full presentation classification. As explained in the previous section, the current study overcomes these limitations. Therefore, the key contributions of this study are:
• a novel active data representation of videos using low-level audio descriptors for predicting expert evaluation of public speaking abilities within videos/presentations, as described in section 2.2;
• an active data representation of videos using low-level video descriptors (modeling of body postures and movements), including dense histogram of gradient (DHOG), dense histogram of flow (DHOF) and dense motion boundary histogram (DMBHx, DMBHy), for predicting expert evaluation of public speaking abilities within videos or presentations, as detailed in section 2.3;
• a low-level video descriptor fusion method for active data representation of videos for predicting expert evaluation of public speaking abilities within videos or presentations, as detailed in section 3.2;
• an automatic scoring system to help teachers in scoring public speaking abilities of students within videos/presentations;
• an automatic feedback generation system for students and teachers to be able to highlight segments of a video presentation that require further attention, for improvement (“bad segments”) or as exemplars of good performance (“good segments”).
5. Conclusion
ADR can be used to generate audio and video features to automatically score presentation delivery skills on video, achieving medium to large correlation with human assigned scores. The active audio data representation provides the best results for SCE, PBL, SCI, and PD. The video data representation provides the best results for RIGP (DHOF features), LAA (DMBHx features), and AVV (DMBHy features). The fusion of audio and video (DHOG features) data representations provides the best results for EC. This study also suggests an approach to the generation of feedback in the form of video segments for presenters and teachers to see which parts of the presentation illustrate good and poor presentation delivery skills. This points toward future work in developing a real-time system for public speaking training, and performing extrinsic evaluation to discover the added value these methods might bring to students and teachers. In addition, the ADR method can also be used to model a full video of conversations and can be exploited in many potential applications, such as evaluating customer experience based on a full customer service conversation, among others.
Data Availability Statement
The dataset analyzed for this study and their derived representations can be obtained by request to the authors.
Ethics Statement
The studies involving human participants were reviewed and approved by School of Computer Science and Statistics, Trinity College Dublin. The patients/participants provided their written informed consent to participate in this study. Written informed consent was obtained from the individual(s) for the publication of any potentially identifiable images or data included in this article.
Author Contributions
FH and SL devised the study, acquired, and performed the preliminary analysis of the dataset. FH conducted the experiments and wrote the initial draft of the manuscript. MK, SL, and CV wrote the subsequent revisions. OC and NC contributed to the writing, reviewed, and provided feedback on the final draft.
Funding
This research has received funding from the European Union's Horizon 2020 research and innovation programme under grant agreement No. 769661, SAAM project at the University of Edinburgh, UK, and ADAPT 13/RC/2106 project (http://www.adaptcentre.ie/) at Trinity College Dublin, the University of Dublin, Ireland. MK was funded by the H2020 Marie Sklodowska-Curie grant agreement No. 701621.
Conflict of Interest
The authors declare that the research was conducted in the absence of any commercial or financial relationships that could be construed as a potential conflict of interest.
Acknowledgments
The aforementioned funding sources were gratefully acknowledged. We were also grateful to the organizers of the 2014 ICMI Multimodal Learning Analysis Challenge for access to MLA dataset.
Supplementary Material
The Supplementary Material for this article can be found online at: https://www.frontiersin.org/articles/10.3389/fcomp.2020.00001/full#supplementary-material
Footnotes
1. ^https://github.com/naxingyu/opensmile/blob/master/config/emobase.conf (last accessed September 2019).
2. ^For the complete set of results please consult the Supplementary Material.
3. ^For complete results please consult the Supplementary Material.
4. ^https://developer.microsoft.com/en-us/windows/kinect (accessed September 2018).
References
Bellanca, J., and Brandt, R. (2010). 21st Century Skills: Rethinking How Students Learn. Bloomington, IN: Solution Tree Press.
Cao, Z., Hidalgo Martinez, G, Simon, T., Wei, S.-E., and Sheikh, YA. (2017). “Realtime multi-person 2d pose estimation using part affinity fields,” in The IEEE Conference on Computer Vision and Pattern Recognition (CVPR) (Honolulu), 7291–7299. doi: 10.1109/CVPR.2017.143
Carnell, S., Lok, B., James, M. T., and Su, J. K. (2019). “Predicting student success in communication skills learning scenarios with virtual humans,” in Proceedings of the 9th International Conference on Learning Analytics & Knowledge, LAK19 (New York, NY: ACM), 436–440.
Chatfield, K., Lempitsky, V., Vedaldi, A., and Zisserman, A. (2011). “The devil is in the details: an evaluation of recent feature encoding methods,” in Proceedings of the British Machine Vision Conference (Dundee: BMVA Press), 76.1–76.12. doi: 10.5244/C.25.76
Chen, L., Leong, C. W., Feng, G., and Lee, C. M. (2014). “Using multimodal cues to analyze MLA'14 oral presentation quality corpus: presentation delivery and slides quality,” in Proceedings of the 2014 ACM Workshop on Multimodal Learning Analytics Workshop and Grand Challenge, MLA '14 (New York, NY: ACM), 45–52.
Cowen, A. S., Laukka, P., Elfenbein, H. A., Liu, R., and Keltner, D. (2019). The primacy of categories in the recognition of 12 emotions in speech prosody across two cultures. Nat. Hum. Behav. 3, 369–382. doi: 10.1038/s41562-019-0533-6
Curtis, K., Jones, G. J., and Campbell, N. (2015). “Effects of good speaking techniques on audience engagement,” in Proceedings of the 2015 ACM on International Conference on Multimodal Interaction (Seattle, WA: ACM), 35–42.
Dalal, N., and Triggs, B. (2005). “Histograms of oriented gradients for human detection,” in IEEE Computer Society Conference on Computer Vision and Pattern Recognition, 2005. CVPR 2005, Vol. 1 (San Diego, CA: IEEE), 886–893.
Das, S., Thonnat, M., Sakhalkar, K., Koperski, M., Bremond, F., and Francesca, G. (2019). “A new hybrid architecture for human activity recognition from RGB-D videos,” in International Conference on Multimedia Modeling (Thessaloniki: Springer), 493–505.
DeCoske, M. A., and White, S. J. (2010). Public speaking revisited: delivery, structure, and style. Am. J. Health Syst. Pharm. 67, 1225–1227. doi: 10.2146/ajhp090508
Echeverría, V., Avendaño, A., Chiluiza, K., Vásquez, A., and Ochoa, X. (2014). “Presentation skills estimation based on video and kinect data analysis,” in Proceedings of the 2014 ACM Workshop on Multimodal Learning Analytics Workshop and Grand Challenge, MLA '14 (New York, NY: ACM), 53–60.
Eyben, F., Wöllmer, M., and Schuller, B. (2009). “OpenEAR–introducing the Munich open-source emotion and affect recognition toolkit,” in 2009 3rd International Conference on Affective Computing and Intelligent Interaction and Workshops (Amsterdam), 1–6.
Eyben, F., Wöllmer, M., and Schuller, B. (2010). “OpenSMILE: the Munich versatile and fast open-source audio feature extractor,” in Proceedings of the 18th ACM International Conference on Multimedia (Firenze: ACM), 1459–1462.
FFmpeg Developers (2016). FFmpeg Tool (Version be1d324) [software]. Available online at: http://ffmpeg.org/
Garg, S. (2018). “Learning video features for multi-label classification,” in European Conference on Computer Vision (Munich: Springer), 325–337.
Grandstaff, D. (2004). Speaking as a Professional: Enhance Your Therapy or Coaching Practice Through Presentations, Workshops, and Seminars. A Norton Professional Book. W.W. Norton & Company. Available online at: https://www.amazon.co.uk/Speaking-Professional-Coaching-Presentations-Workshops/dp/0393704335
Haider, F., Cerrato, L., Campbell, N., and Luz, S. (2016a). “Presentation quality assessment using acoustic information and hand movements,” in 2016 IEEE International Conference on Acoustics, Speech and Signal Processing (ICASSP) (Shanghai: IEEE), 2812–2816.
Haider, F., Cerrato, L. S., Luz, S., and Campbell, N. (2016b). “Attitude recognition of video bloggers using audio-visual descriptors,” in Proceedings of the Workshop on Multimodal Analyses Enabling Artificial Agents in Human-Machine Interaction (Tokyo: ACM), 38–42.
Haider, F., and Luz, S. (2019). “Attitude recognition using multi-resolution cochleagram features,” in 2019 IEEE International Conference on Acoustics, Speech and Signal Processing (ICASSP) (Brighton: IEEE).
Haider, F., Salim, F. A., Luz, S., Vogel, C., Conlan, O., and Campbell, N. (2017). “Visual, laughter, applause and spoken expression features for predicting engagement within ted talks,” in Proceedings of Interspeech 2017 (Stockholm), 2381–2385.
Hassan, M. M., Alam, M. G. R., Uddin, M. Z., Huda, S., Almogren, A., and Fortino, G. (2019). Human emotion recognition using deep belief network architecture. Inform. Fusion 51, 10–18. doi: 10.1016/j.inffus.2018.10.009
Hattie, J., and Timperley, H. (2007). The power of feedback. Rev. Educ. Res. 77, 81–112. doi: 10.3102/003465430298487
Hincks, R. (2005). Measures and perceptions of liveliness in student oral presentation speech: a proposal for an automatic feedback mechanism. System 33, 575–591. doi: 10.1016/j.system.2005.04.002
Horn, B. K., and Schunck, B. G. (1981). Determining optical flow. Artif. Intell. 17, 185–203. doi: 10.1016/0004-3702(81)90024-2
Huang, Y., Gilmartin, E., and Campbell, N. (2016). “Conversational engagement recognition using auditory and visual cues,” in Interspeech 2016 (San Francisco, CA), 590–594.
Itseez (2018). Open Source Computer Vision Library. Available online at: https://github.com/itseez/opencv
Ju, T.-F., Chen, Y.-Y., Chiu, C.-H., and Syu, Y.-J. (2019). Method and Module of Gesture Recognition. US Patent App. 15/853,840. Available online at: https://patents.google.com/patent/US10417485B2/en
Kohonen, T. (1998). The self-organizing map. Neurocomputing 21, 1–6. doi: 10.1016/S0925-2312(98)00030-7
Krajewski, J., Batliner, A., and Kessel, S. (2010). “Comparing multiple classifiers for speech-based detection of self-confidence-a pilot study,” in 2010 20th International Conference on Pattern Recognition (ICPR) (Istanbul: IEEE), 3716–3719.
Kuny, S., and Stassen, H. H. (1993). Speaking behavior and voice sound characteristics in depressive patients during recovery. J. Psychiatr. Res. 27, 289–307. doi: 10.1016/0022-3956(93)90040-9
Lamerton, J. (2001). Public Speaking. Everything You Need to Know. Harpercollins Publishers Ltd. Available online at: https://www.amazon.co.uk/Public-Speaking-Everything-Need-Know/dp/0007102356
Lee, J., Natsev, A. P., Reade, W., Sukthankar, R., and Toderici, G. (2018). “The 2nd youtube-8m large-scale video understanding challenge,” in European Conference on Computer Vision (Munich: Springer), 193–205.
Lin, R., Xiao, J., and Fan, J. (2018). “Nextvlad: an efficient neural network to aggregate frame-level features for large-scale video classification,” in European Conference on Computer Vision (Munich: Springer), 206–218.
Liu, C., Calvo, R. A., and Lim, R. (2016). Improving medical students' awareness of their non-verbal communication through automated non-verbal behavior feedback. Front. ICT 3:11. doi: 10.3389/fict.2016.00011
Luzardo, G., Guamán, B., Chiluiza, K., Castells, J., and Ochoa, X. (2014). “Estimation of presentations skills based on slides and audio features,” in Proceedings of the 2014 ACM Workshop on Multimodal Learning Analytics Workshop and Grand Challenge, MLA '14 (New York, NY: ACM), 37–44.
Ochoa, X., Domínguez, F., Guamán, B., Maya, R., Falcones, G., and Castells, J. (2018). “The RAP system: automatic feedback of oral presentation skills using multimodal analysis and low-cost sensors,” in Proceedings of the 8th International Conference on Learning Analytics and Knowledge, LAK '18 (New York, NY: ACM), 360–364.
Ochoa, X., Worsley, M., Chiluiza, K., and Luz, S. (2014). “Mla'14: third multimodal learning analytics workshop and grand challenges,” in Proceedings of the 16th International Conference on Multimodal Interaction, ICMI '14 (New York, NY: ACM), 531–532.
Perronnin, F., Sánchez, J., and Mensink, T. (2010). “Improving the fisher kernel for large-scale image classification,” in European Conference on Computer Vision (Crete: Springer), 143–156.
Rasmussen, C. E., and Williams, C. K. (2006). Gaussian Processes for Machine Learning, Vol. 1. Cambridge, MA: MIT Press.
Rouvier, M., Dupuy, G., Gay, P., Khoury, E., Merlin, T., and Meignier, S. (2013). An Open-Source State-of-the-Art Toolbox for Broadcast News Diarization. Technical Report, Interspeech, Lyon.
Schreiber, L. M., Paul, G. D., and Shibley, L. R. (2012). The development and test of the public speaking competence rubric. Commun. Educ. 61, 205–233. doi: 10.1080/03634523.2012.670709
Singh, T., and Vishwakarma, D. K. (2019). “Human activity recognition in video benchmarks: a survey,” in Advances in Signal Processing and Communication Vol. 526, eds B. Rawat, A. Trivedi, S. Manhas, and V. Karwal (Singapore: Springer), 247–259.
Tang, Y., Zhang, X., Wang, J., Chen, S., Ma, L., and Jiang, Y.-G. (2019). “Non-local netvlad encoding for video classification,” in Computer Vision—ECCV 2018 Workshops, eds L. Leal-Taixé and S. Roth (Cham: Springer International Publishing), 219–228.
Traunmüller, H., and Eriksson, A. (1995). The perceptual evaluation of f0 excursions in speech as evidenced in liveliness estimations. J. Acoust. Soc. Am. 97, 1905–1915. doi: 10.1121/1.412942
Uijlings, J., Duta, I., Sangineto, E., and Sebe, N. (2015). Video classification with densely extracted hog/hof/mbh features: an evaluation of the accuracy/computational efficiency trade-off. Int. J. Multimed. Inform. Retriev. 4, 33–44. doi: 10.1007/s13735-014-0069-5
Vanmassenhove, E., Cabral, J. P., and Haider, F. (2016). “Prediction of emotions from text using sentiment analysis for expressive speech synthesis,” in 9th ISCA Speech Synthesis Workshop (Sunnyvale, CA), 21–26.
Vedaldi, A., and Fulkerson, B. (2008). VLFeat: An Open and Portable Library of Computer Vision Algorithms. Available online at: http://www.vlfeat.org/
Ward, A. E. (2013). “The assessment of public speaking: a pan-european view,” in 2013 12th International Conference on Information Technology Based Higher Education and Training (ITHET) (Antalya), 1–5.
Yung, L. S., Wong, W. K., and Shum, H. C. (2019). Hand Gesture Recognition System and Method. US Patent App. 15/671,196. Available online at: https://patents.google.com/patent/US20190049558A1/en
Keywords: multimodal learning analytics, social signal processing, feature extraction, multimedia signal processing, video analysis and summarization, machine learning
Citation: Haider F, Koutsombogera M, Conlan O, Vogel C, Campbell N and Luz S (2020) An Active Data Representation of Videos for Automatic Scoring of Oral Presentation Delivery Skills and Feedback Generation. Front. Comput. Sci. 2:1. doi: 10.3389/fcomp.2020.00001
Received: 15 July 2019; Accepted: 03 January 2020;
Published: 28 January 2020.
Edited by:
Anna Esposito, University of Campania Luigi Vanvitelli, ItalyReviewed by:
Oliver Jokisch, Hochschule für Telekommunikation Leipzig, GermanyCostanza Navarretta, University of Copenhagen, Denmark
Copyright © 2020 Haider, Koutsombogera, Conlan, Vogel, Campbell and Luz. This is an open-access article distributed under the terms of the Creative Commons Attribution License (CC BY). The use, distribution or reproduction in other forums is permitted, provided the original author(s) and the copyright owner(s) are credited and that the original publication in this journal is cited, in accordance with accepted academic practice. No use, distribution or reproduction is permitted which does not comply with these terms.
*Correspondence: Saturnino Luz, s.luz@ed.ac.uk
†ORCID: Fasih Haider 0000-0002-5150-3359
Maria Koutsombogera 0000-0001-6650-4541
Saturnino Luz 0000-0001-8430-7875